Test pattern PFM03 is intended for
Sample description
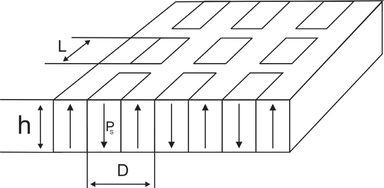
Lithium niobate (LiNbO3) single-crystalline 500- µm-thick plate with roughness less than 10 nm cut normal to the polar axis. A regular domain structure with period D was created in the sample. The spontaneous polarization has the opposite direction in the neighboring domains. The polarization direction determines the sign of piezoelectric coefficient. Analysis of the local piezoelectric response during application of the modulation voltage allows to reveal the domain pattern.
Specification• Sample size – 5x5 mm
• Sample thickness, h – 500 µm
• Period, D – 10 µm
• Dash length, L – 100 µm
• Fixed on a metal substrate by conductive epoxy.
|
 |
Quick Start Guide
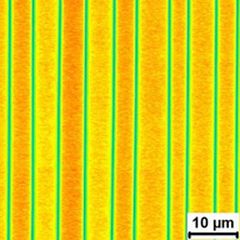
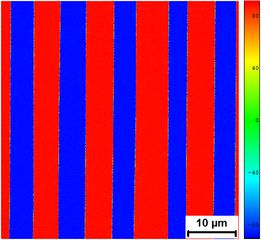
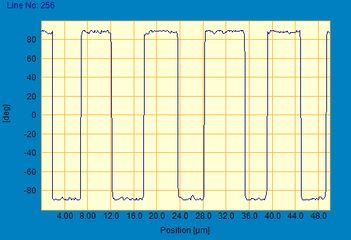
The sample is fixed on the AFM holder and its bottom electrode is grounded. The measurements are held in contact mode. AC voltage with a frequency fmod is applied to AFM tip. The sample surface oscillates with the same frequency. This response is analyzed using the lock-in amplifier. The domain walls contrast can be obtained in the amplitude of the piezoresponse signal, and domain contrast – in the phase of the signal. The typical images obtained by PFM mode are shown in Figure 1.
 (a)
(a)  (b)
(b)  (c)
(c)
Figure 1. The typical domain pattern obtained in the sample by PFM mode: (a) amplitude and (b) phase of piezoresponse signal, (c) phase profile.
Diamond coated conductive tip.
AC voltage amplitude 7,5 V, fmod = 17 kHz.


